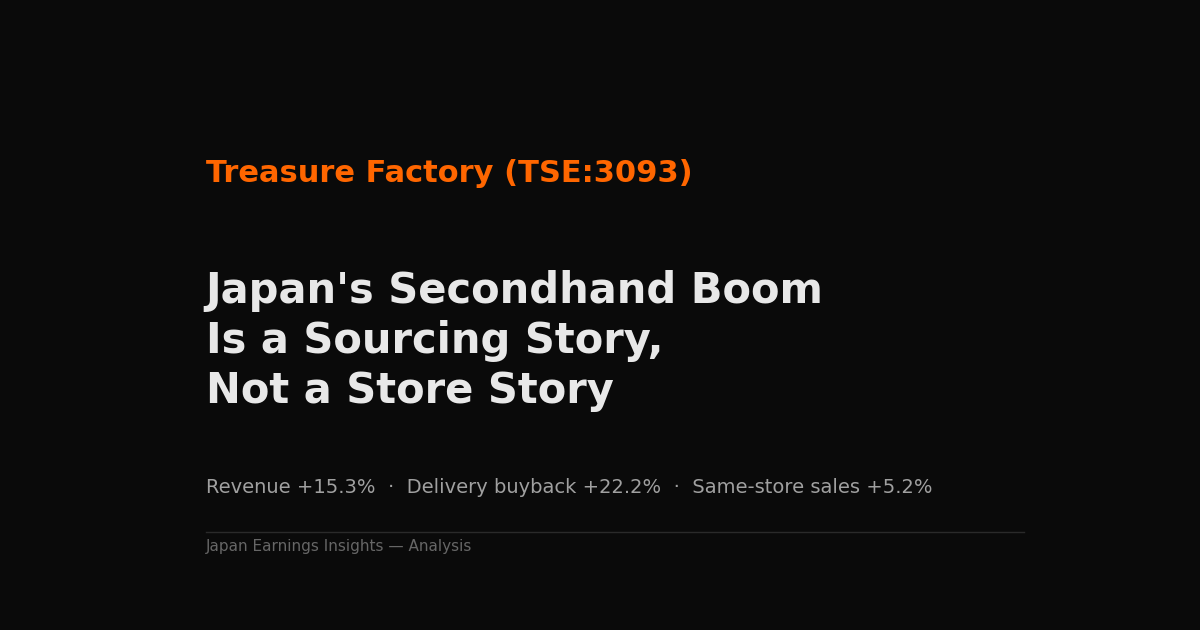
Treasure Factory Co., Ltd. (TSE:3093) operates 337 secondhand stores across seven banners — TreFac Style, Treasure Factory, Kind Oak, Useless, Golf Kids, TreFac Sports Outdoor, and Pick Up — concentrated in the Kanto, Kansai, and Tokai regions, with a small outpost of six stores in Thailand and three in Taiwan. H1 FY2027 (March–August 2026) revenue grew 15.3% to JPY 25.9bn, operating profit grew 21.5% to JPY 2.33bn, and the company raised its annual dividend forecast 15% to JPY 46.00 per share. The headline story is straightforward: Japan’s secondhand market is growing, and Treasure Factory is a clean way to own it. The more useful story is in how that growth is actually being sourced.
The Growth Isn’t Coming From the Stores
Treasure Factory’s buy-side — how it sources the merchandise it resells — is organized into four channels: customers walking merchandise into a store, home pickup services, on-site appraisal visits, and EC. This half, those four channels grew at dramatically different rates.
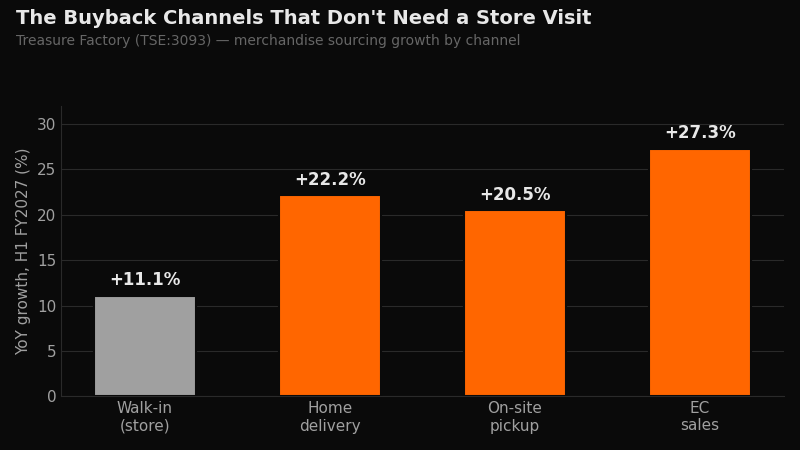 Figure 1: YoY growth in merchandise sourcing by channel, Treasure Factory (TSE:3093), H1 FY2027
Walk-in buyback — the channel tied directly to store traffic and store count — grew 11.1%. Home delivery buyback grew 22.2%. On-site pickup buyback grew 20.5%. EC sales grew 27.3%, the fastest of any channel in the business. Total merchandise purchases grew 14.6% group-wide.
This matters more than it looks. A secondhand retailer’s real constraint is not shelf space or foot traffic — it is the supply of sellable inventory. If sourcing growth were concentrated in walk-in buyback, Treasure Factory’s growth ceiling would be tied to how many stores it can open and how much foot traffic each one draws, in a country where that traffic is not growing. Instead, the fastest-growing sourcing channels are ones that scale independently of store count. That decouples the growth story from the retail footprint — a distinction foreign investors evaluating this as “a chain of secondhand stores” are likely to miss.
Crucially, this is not purely a sourcing-channel mix shift papering over soft stores: same-store sales (existing stores, standalone basis) grew 5.2% YoY, and the company opened 19 new directly-run stores against one closure. The store network itself is still healthy and still expanding — the buyback-channel diversification is additive, not a sign that the physical business is stalling.
What’s Actually Selling
By category, accessories and watches (+18.5%) and hobby/outdoor goods (+20.5%) grew fastest, ahead of apparel (+14.5%) and appliances (+12.5%) — consistent with the company’s own characterization of a shift in Japanese consumer behavior from “buying because it’s cheap” toward “choosing deliberately,” where higher-consideration, higher-unit-price categories are gaining share within the reuse basket. The company explicitly ties this, and the broader reuse demand, to cost-of-living pressure from persistent price increases and growing interest in circular consumption — not simply a recession-driven shift to cheaper goods.
The Margin Question
Gross margin improved only marginally this half, from 60.0% to 60.2%, as the cost of merchandise purchased grew 14.6% — almost exactly in line with revenue growth of 15.3%. That is the detail worth sitting with: the shift toward delivery and pickup buyback channels, which presumably carry their own logistics costs even as they source more volume, has not yet shown up as a step-change in unit economics. The buy-side diversification is working as a volume and reach strategy; whether it eventually becomes a margin strategy is not yet demonstrated in the numbers.
Balance Sheet and Cash Flow
Treasure Factory is moderately levered, not debt-free: total borrowings of JPY 7.94bn (no bonds) against cash of JPY 4.42bn, a net debt position of roughly JPY 3.5bn, with an equity ratio of 50.8%. Return on equity is strong — H1 net profit of JPY 1.50bn against JPY 13.96bn in net assets implies a full-year run rate comfortably above 20%.
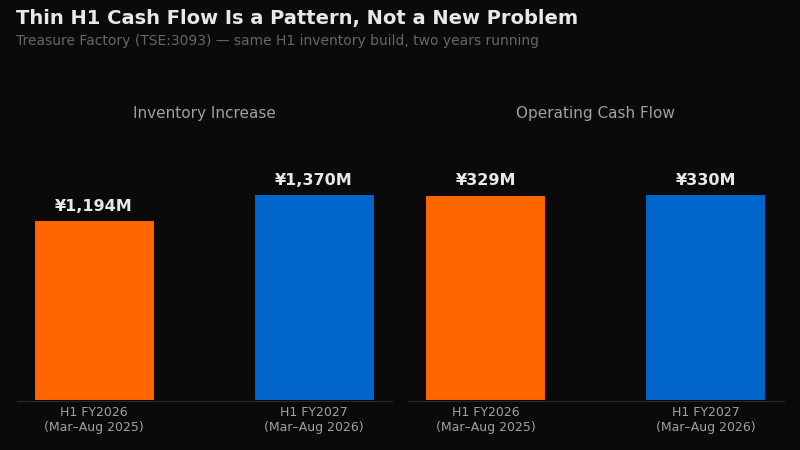 Figure 2: H1 inventory build and operating cash flow, two years compared, Treasure Factory (TSE:3093)
Operating cash flow this half was a thin JPY 330M against JPY 1.50bn of net profit — a gap explained almost entirely by a JPY 1.37bn increase in inventory, as the company buys ahead of sell-through. Taken alone, that looks like a red flag. Taken alongside last year’s H1, it looks like a pattern: H1 FY2026 (March–August 2025) also saw a JPY 1.19bn inventory build and JPY 329M of operating cash flow — virtually identical to this year, and scaling at roughly the same rate as revenue growth. New-store capex (JPY 786M this half) and lease deposits for new locations are funded partly through new borrowing rather than internally generated cash, which is why the balance sheet carries net debt despite strong reported profitability.
None of this is inherently alarming for a retailer in a buy-then-sell model that is actively opening stores — thin H1 cash flow tied to inventory building ahead of the stronger second-half selling season is a normal seasonal pattern, not a new deterioration, based on the two years of data available. What would actually be concerning is if this pattern stopped being seasonal and became structural — inventory that keeps building without converting to cash, rather than a consistent H1 build that resolves over the full year. We do not have full-year FY2026 cash flow data on hand to confirm that resolution; it is worth checking against the next full-year filing rather than assuming it from this comparison alone.
Valuation
At the October 14 close of JPY 1,908, Treasure Factory trades at roughly 12.6x forecast earnings (full-year EPS guidance of JPY 151.49) and 3.25x book value, with a 2.4% forecast dividend yield. For a business compounding revenue in the mid-teens with operating profit growing faster than revenue and ROE above 20%, that is not an expensive valuation — though the moderate leverage and the recurring H1 cash-flow squeeze are reasons the market may not be assigning this stock a richer multiple.
What to Watch
Unchanged: the core growth engine — buyback-channel diversification plus genuine same-store sales growth — looks structurally sound and is not simply a store-opening illusion.
Not a concern on its own: the thin H1 operating cash flow. It mirrors last year’s H1 almost exactly and is explained by seasonal inventory build ahead of store expansion.
The thing to actually watch: whether gross margin ever expands meaningfully beyond its current ~60% level as the buyback channel mix keeps shifting away from walk-in traffic, and whether the H1 cash-flow pattern resolves by fiscal year-end as it appears to have in the past. A chronic version of this pattern — inventory that keeps building without that resolution — would be the real signal to watch for, not the current, apparently seasonal, read.
Source: Original filing (TDnet) | 日本語版
Disclaimer | This article is for informational purposes only and does not constitute investment advice.