On September 14, Samco Corporation (TSE:6387), a Kyoto-based maker of thin-film deposition equipment for compound semiconductors, reported full-year results for the fiscal year ended July 2026. Revenue rose 15.6% to ¥10.8 billion. Operating profit rose 28.2% to ¥3.00 billion — beating the guidance the company itself had raised only three months earlier, in June, to ¥2.63 billion. The year-end dividend went from ¥60.00 to ¥75.00 per share, a 25% increase, with the same payout guided for next year. Guidance for the coming fiscal year calls for another 34.3% revenue increase and 29.1% operating profit growth.
By almost any conventional measure, this is a clean beat-and-raise. And the stock is still trading around 44% below the ¥14,470 all-time high it hit in May.
That gap is the real story here — not because Samco did anything wrong, but because it is a compact, recent, and unusually clean illustration of a question every investor in Japan’s semiconductor equipment names needs an answer to right now: how much of the AI infrastructure buildout is already priced in, and where does the risk actually sit in the supply chain?
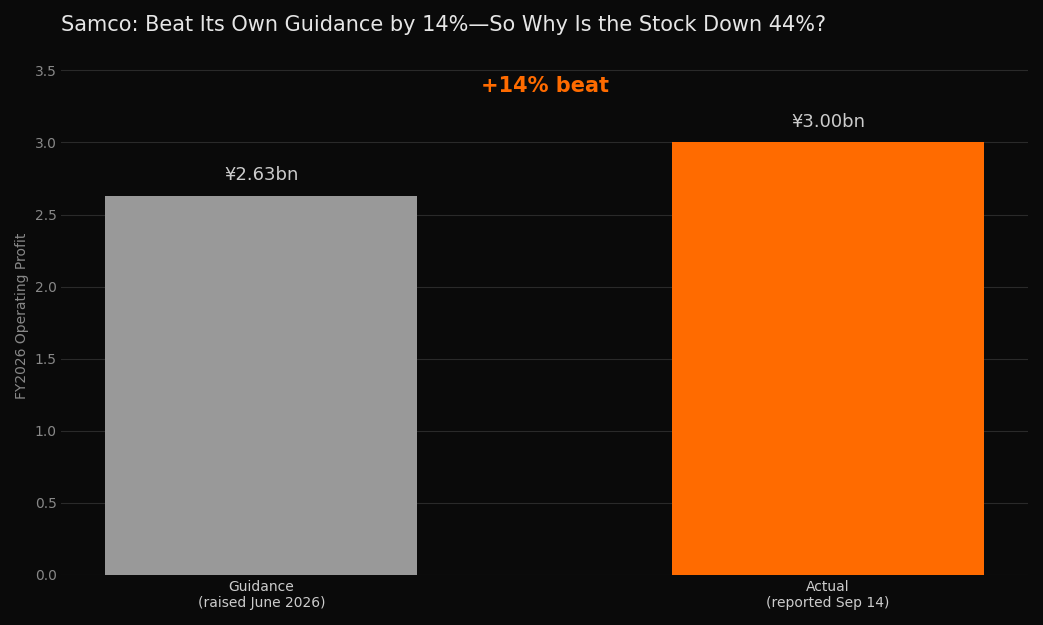 Figure 1: FY2026 operating profit came in 14% above the guidance Samco itself raised in June.
The Beat, in Detail
Samco’s core business is deposition equipment used to manufacture compound semiconductor components — chiefly the optical devices that carry data inside AI data centers, a segment that made up roughly 40% of revenue in the year. As of Samco’s Q3 update in June, electronic-component processing equipment revenue was up 151.6% year-over-year and compound semiconductor equipment was up 52.9%, while the legacy silicon semiconductor segment fell 65.2% — a sharp illustration of how concentrated the current growth is in AI-adjacent demand versus everything else the company makes.
Operating margin for the full year came in at 27.8%, up from prior-year levels, and the equity ratio eased slightly to 72.6% from 76.3% — still an exceptionally conservative balance sheet for a company growing this fast.
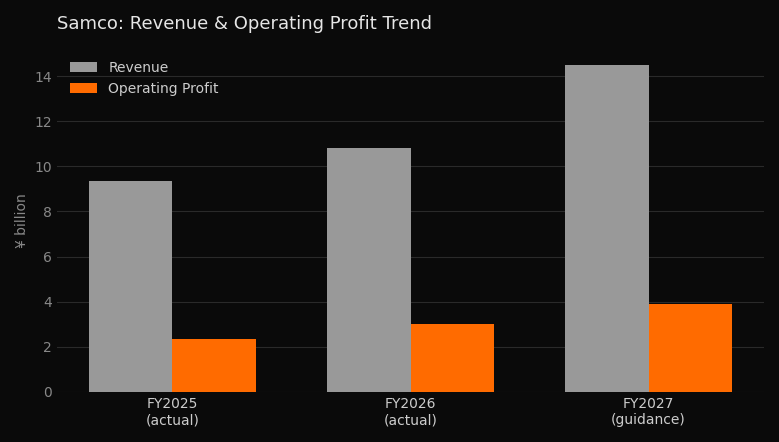 Figure 2: Revenue and operating profit, FY2025 actual through FY2027 guidance (¥ billion).
A Quiet Red Flag: Capex Didn’t Follow the Guidance
Buried in the cash flow statement is a detail that gets less attention than the headline beat but arguably matters more for judging next year’s guidance: capital expenditure (purchases of property and equipment) fell to ¥121 million in FY2026, down from ¥407 million the year before — even as management guides for a 34.3% jump in revenue next year.
That is not necessarily damning. A capital-light equipment maker can grow revenue for a stretch by running existing capacity harder before it needs to invest in new lines. But it is worth flagging precisely because it cuts against the read-through most investors apply to strong equipment-maker results: that rising revenue implies rising capacity investment, which in turn implies rising confidence in sustained demand. Here, the confidence (in the form of an aggressive guidance number) arrived before the capital commitment did. If next year’s growth requires capacity Samco has not yet built, execution risk — not demand risk — becomes the thing to watch.
What the Stock Price Is Actually Pricing In
Using the freshly reported FY2026 figures, Samco’s roughly 8.03 million diluted shares translate to EPS of about ¥278. At a share price near ¥8,030 this week, that puts the trailing P/E at roughly 29x — down from the 38x P/E recorded when shares traded at ¥9,160 in August, largely because the stock, not the earnings, moved.
Book value per share works out to roughly ¥1,688, putting price-to-book around 4.8x. Return on equity for the year was approximately 16.5%, up from 13.1% as of the August print. A rough sanity check — dividing ROE by a plausible required return of around 10% for a small, thinly covered, thinly traded stock — implies a “no further growth” fair P/B closer to 1.6x. The market is paying roughly three times that, which means the current price is a bet that ROE keeps expanding from here, not merely that it holds.
The more forgiving number is the PEG ratio — P/E divided by the growth rate. Against next year’s guided 29.1% operating profit growth, Samco’s P/E of ~29x produces a PEG of almost exactly 1.0, the textbook threshold for “fairly valued” under the classic Peter Lynch heuristic. Read one way, this says the post-peak decline has already done most of the work of correcting the stock’s valuation. Read the other way, it says the entire remaining valuation case now rests on management delivering, in full, a guidance number that was issued without a matching increase in capital investment.
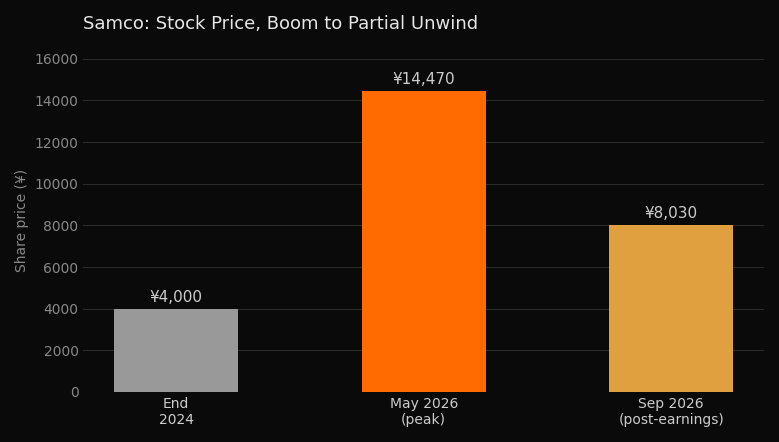 Figure 3: Samco shares roughly quadrupled from late 2024 through the May 2026 peak, then gave back close to half that gain.
There is also a structural reason Samco’s stock moves this hard in both directions: shares outstanding are essentially fixed at just over 8 million, with no split in this report and none planned. A market capitalization in the mid-¥60 billions, split across a genuinely small share count, with minimal analyst coverage, is a combination that amplifies both enthusiasm and disappointment far beyond what the underlying business fundamentals alone would justify.
Equipment vs. Materials: Why This Layer of the Supply Chain Swings Hardest
Zoom out from Samco to the semiconductor supply chain as a whole, and there is a useful distinction between two kinds of suppliers. Materials and component makers — silicon wafers, photoresist, specialty gases, ceramic packaging — sell consumables tied to however much production volume is already running, regardless of which company or which technology ultimately wins a given cycle. Demand for these inputs tends to track output more smoothly.
Equipment makers sell something fundamentally different: the means to build new capacity. That revenue is tied to a discrete, front-loaded capital decision by a customer, not to ongoing output. When hyperscalers and foundries are actively expanding, equipment orders are the first thing to accelerate and typically accelerate the hardest, because a single capacity decision can represent years of revenue pulled forward. When that same customer base pauses to digest capacity it has already built — a completely normal and recurring phase in every semiconductor cycle — equipment orders are the first thing to slow, often before any weakness shows up anywhere else in the chain. Materials and component suppliers, by contrast, keep collecting revenue on whatever is still running through existing fabs.
This is the structural reason semiconductor equipment stocks — Samco included — carry a different, generally higher, risk profile than the materials and components suppliers further downstream, independent of how good any single quarter’s results look.
The Dot-Com Fiber Question
The broader debate this earnings report sits inside is whether today’s AI infrastructure buildout resembles the personal computer’s slow climb to ubiquity — Windows took roughly 14 years from the original IBM PC to Windows 95-era mainstream adoption, and the commercial internet took about a decade to become a genuine mass-market utility — or whether it resembles the 1999-2001 fiber-optic buildout: a long-term thesis that turned out to be correct, wrapped around a multi-year period in which the infrastructure was built well ahead of paying demand, and the companies that built it were structurally overvalued for years before the internet caught up to justify the investment.
Consumer adoption of generative AI has actually moved faster than either historical precedent — weekly active usage scaled to levels PCs and the internet took the better part of a decade to reach. But the capital spending driving names like Samco is not really being justified by consumer habit formation; it is being justified by enterprise return on investment that is still largely unproven, particularly for the kind of precise, auditable, error-intolerant work — financial records, compliance filings, exact data entry — that businesses actually need software to get right before they commit budget at scale. Until that gap between “people use it” and “enterprises trust it with the numbers” closes, the fiber-overbuild scenario remains a live possibility alongside the PC-adoption scenario, and the two imply very different multi-year paths for equipment-layer stock prices even if the long-run demand thesis is identical.
What to Watch
None of this amounts to a call that Samco’s business is at risk. The FY2026 results and FY2027 guidance describe a company executing well in a segment — optical interconnects for AI data centers — that continues to see genuine, hyperscaler-funded demand. The more useful framework is to separate three questions that get conflated in headlines like “semiconductor stocks fall despite strong earnings”: whether the underlying industry is growing (yes, on the evidence so far), whether this specific company’s guidance is achievable given its own capital investment (an open question, given the capex trend), and whether the current share price already reflects a favorable resolution of both (per the PEG and P/B math above, largely yes).
Investors tracking this name and its peers should watch three things in the coming quarters: whether Samco’s own capital expenditure picks up to match its FY2027 guidance, whether hyperscaler capex commentary continues to be revised upward rather than merely growing more slowly, and whether the order backlog and book-to-bill trends at Samco and its equipment-maker peers hold up — since that layer of the supply chain will show cracks, if any appear, well before they show up in materials and component names further downstream.
Source: Original filing (TDnet) | 日本語版
Disclaimer | This article is for informational purposes only and does not constitute investment advice.