Canon Inc. (TSE: 7751) reported first-half FY2026 results on July 27 that were, on aggregate, solid: revenue ¥2,274.5bn (+3.5%), operating profit ¥230.6bn (+7.6%). Respectable numbers. But the aggregate disguises a split that matters for how investors should think about the company’s trajectory.
Within Canon’s four business segments, two are growing strongly and two are contracting sharply — and the divergence is widening. Add a permanently higher US tariff bill to the analysis, and the picture of Canon in mid-2026 is considerably more complex than the headline numbers suggest.
The Segment Split: Two Canons in One Report
The Canon That’s Winning
Imaging — cameras, cinema equipment, surveillance systems, broadcast hardware — grew H1 revenue by +16.9% to ¥552.7bn and operating profit by +38.8% to ¥97.6bn. At a 17.7% operating margin, it is now Canon’s most profitable segment by return rate, despite being second in size.
What’s driving this? Three convergent trends:
First, the mirrorless camera transition. Canon’s EOS R series has established clear market leadership in full-frame mirrorless, capturing professional and enthusiast photographers migrating from legacy DSLR systems. The transition is not complete — there is still a multi-year upgrade cycle ahead. Second, professional cinema. Canon’s Cinema EOS line has become a reference standard for independent film, streaming production, and high-end commercial work. Content production volumes remain elevated post-COVID. Third, network cameras. Canon’s surveillance and IP camera business is growing as urban security infrastructure investment expands across Asia and the Middle East.
The common thread: Canon’s imaging business is benefiting from multiple simultaneous upgrade cycles rather than a single demand spike. That profile is more durable than a one-time boost.
Printing — office multifunction devices, laser printers, large-format printers, document solutions — grew revenue modestly (+1.5%) but expanded operating profit (+5.0%) to ¥157.5bn. At ¥239.8bn of revenue in Q1 alone, Printing remains the largest segment by far and the engine of Canon’s cash generation. Its cost efficiency improved: H1 gross margin in the segment was 47.9% versus 46.5% a year earlier, driven by raw material stabilization and manufacturing optimization.
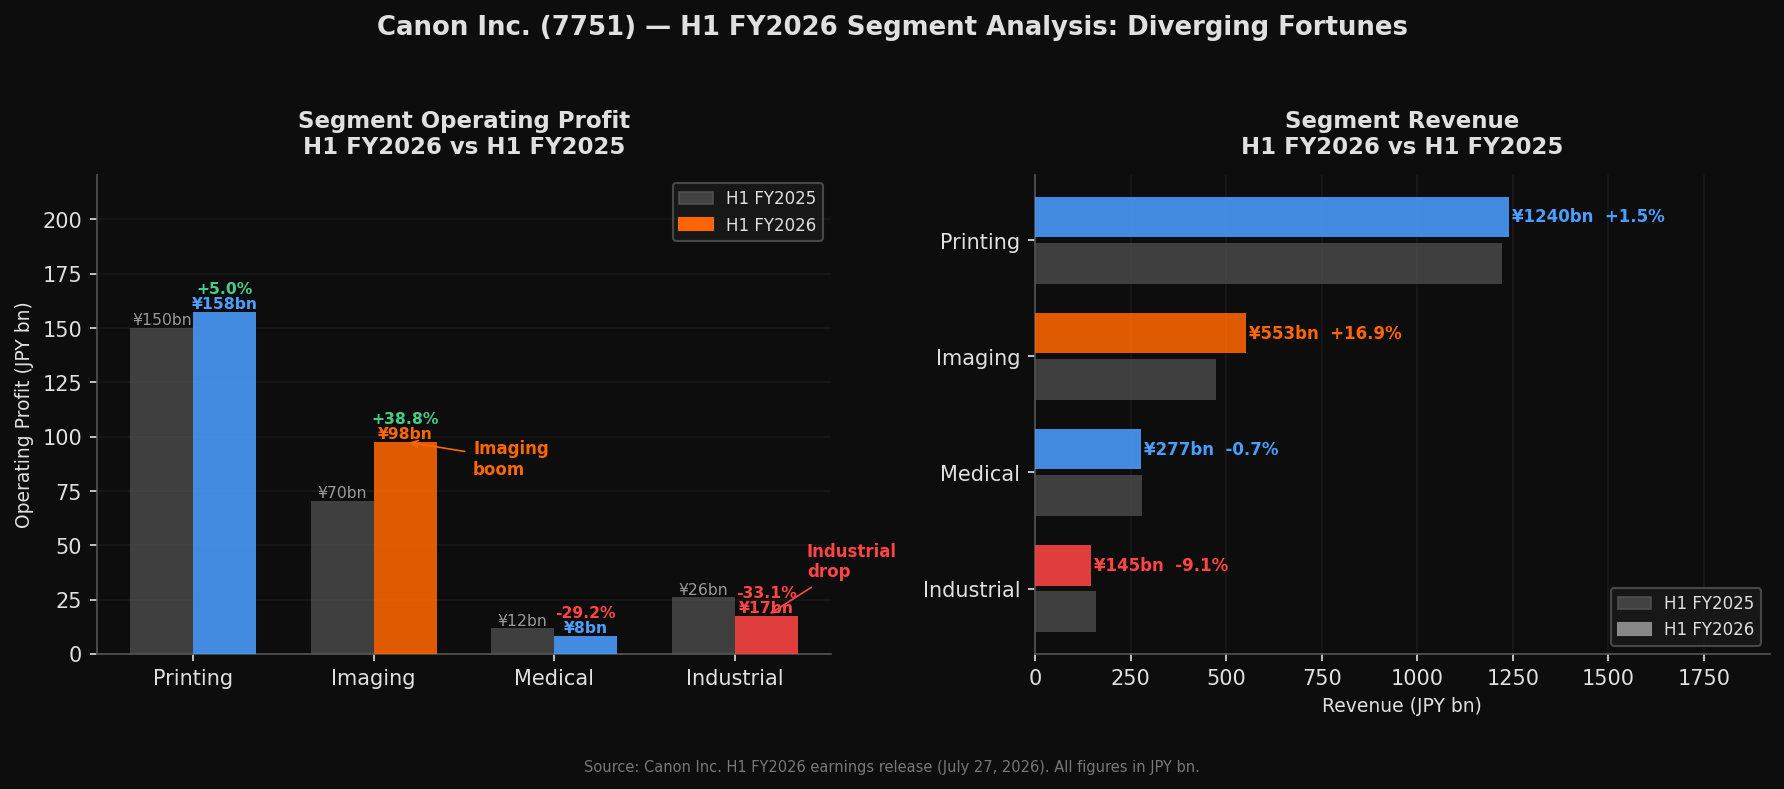 Figure 1: Segment operating profit (left) and revenue (right), H1 FY2026 vs H1 FY2025. The Imaging segment’s operating profit grew ¥27.3bn (+38.8%), while Industrial fell ¥8.6bn (-33.1%). Source: Canon earnings release, July 27, 2026.
The Canon That’s Struggling
Industrial — semiconductor lithography systems, FPD (flat panel display) exposure systems, organic EL manufacturing equipment — posted the worst performance of any segment: revenue -9.1% to ¥145.2bn, operating profit -33.1% to ¥17.4bn. Operating margin fell from 16.3% to 12.0%.
Canon’s lithography business competes in a market where ASML dominates leading-edge EUV and ArF immersion equipment. Canon’s own nanoimprint lithography (NIL) technology has attracted attention — including from TSMC and chip research institutes — but commercial deployment at scale remains limited. The H1 decline reflects the ongoing digestion phase in semiconductor capex following the 2021–2023 investment surge, combined with customer caution ahead of technology transitions.
The industrial capex increased (+20% to ¥9.5bn in H1), suggesting Canon is investing into the weakness rather than retreating. This is consistent with a long-term NIL commercialization bet — but it means earnings pressure in this segment will persist until adoption accelerates.
Medical — CT systems, ultrasound, MRI, ophthalmic equipment, in-vitro diagnostics — fell -0.7% in revenue and -29.2% in operating profit to ¥8.3bn. The medical segment is structurally attractive (aging populations, hospital capex) but operationally heavy. Operating margin has compressed to 3.0% as Canon Medical continues to absorb the SG&A costs of its global expansion. Research and development spending increased marginally (+3.1%) while “other operating expenses” rose +9.6% — indicative of sales force and distribution investments that have not yet converted to revenue.
The Gross Margin Improvement Nobody Noticed
One of the most important numbers in Canon’s H1 report received almost no attention: the cost of sales fell by ¥11.3bn (-1.0%) while revenue grew by ¥75.9bn (+3.5%).
Gross margin improved from 47.1% to 49.4% — a 2.3 percentage point expansion. For a company with ¥2.27 trillion in half-year revenue, 2.3 points represents roughly ¥52bn in additional gross profit relative to the prior year’s margin rate.
The improvement is driven by product mix (Imaging’s higher margins now represent a larger share of the total) and manufacturing cost efficiency in Printing. This gross margin expansion is what allowed operating profit to grow +7.6% despite selling expenses rising +8.7% and R&D spending climbing +8.3%. The cost base is growing — but the revenue mix is improving faster.
The Americas: Canon’s Largest Market, Now With a Permanent Tariff Surcharge
Canon’s geographic breakdown reveals the significance of the Americas to its business — and the cost of the Section 301 tariff that took effect on July 24.
The Americas generated ¥725.8bn in H1 FY2026 revenue, representing 31.9% of Canon’s total. It is Canon’s single largest geographic market, slightly ahead of Europe (¥605.1bn, 26.6%). Both grew — Americas +3.7%, Europe +6.2% — while domestic Japan declined -1.1%.
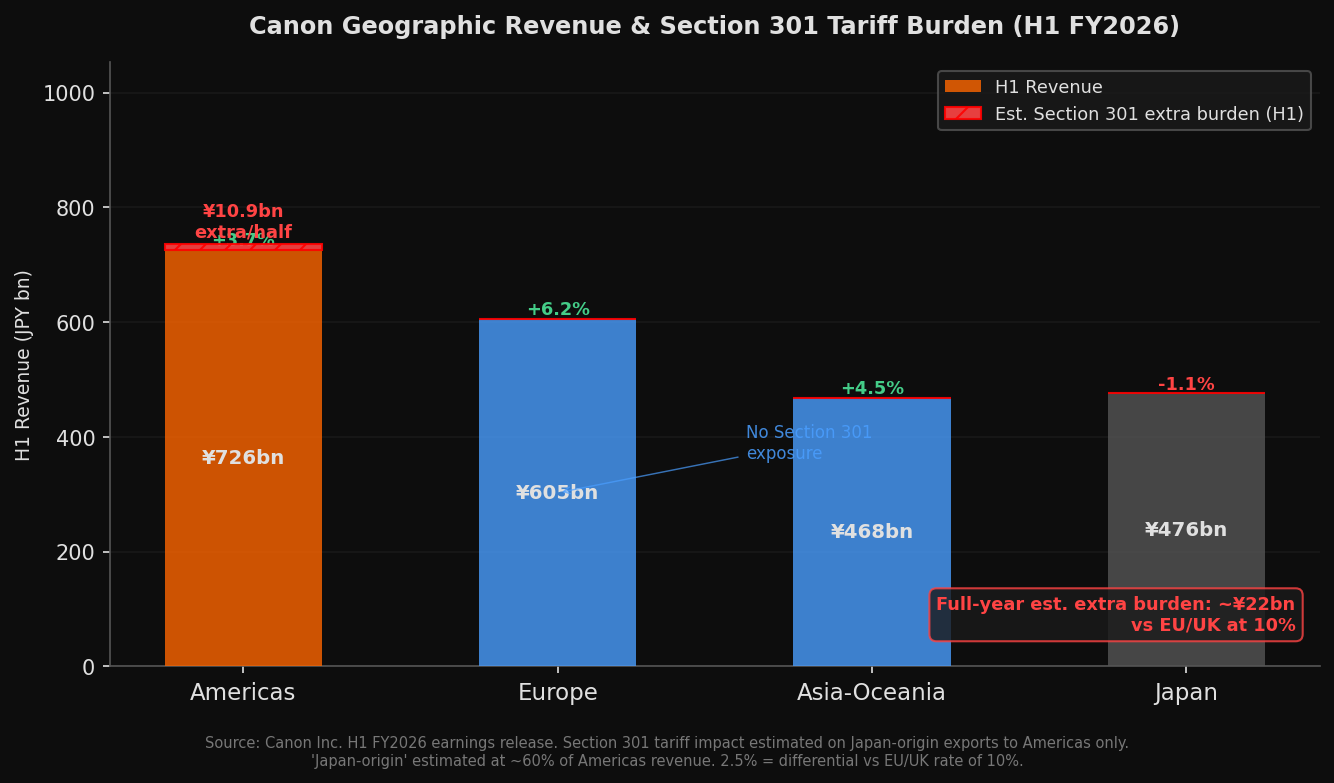 Figure 2: H1 revenue by geography. The red band on the Americas bar represents the estimated Section 301 extra burden (¥10.9bn for H1, ~¥22bn annualized). Europe carries no equivalent Section 301 burden. Source: Canon earnings release; tariff burden estimated as ~60% Japan-origin Americas revenue × 2.5%.
The Section 301 tariff imposed on Japan — 12.5% versus the 10% rate applied to the EU and UK — creates a structural cost differential that did not exist before July 24. The mechanism:
Canon manufactures most of its cameras, lenses, cinema equipment, and precision industrial products in Japan. These goods, shipped to the US, now face a 12.5% import tariff. Canon’s EU competitors who export into the same US market from European plants pay 10%. The 2.5% gap flows directly into Canon’s cost structure for US-bound exports.
Estimating the impact requires assumptions about what share of Canon’s Americas revenue is Japan-origin (as opposed to locally manufactured or sourced from third countries). Canon’s US manufacturing is limited — primarily some toner and component assembly in Virginia. The majority of its camera, lens, industrial, and office equipment sold in the Americas originates from Japanese plants.
Assuming approximately 60% of Americas revenue is Japan-origin:
| Metric | H1 Estimate | Full-Year Estimate |
|---|---|---|
| Japan-origin Americas revenue | ~¥435bn | ~¥870bn |
| Extra 2.5% Section 301 burden | ~¥10.9bn | ~¥21.8bn |
| As % of H1 operating profit (¥231bn) | ~4.7% | — |
| As % of guided full-year OP (¥465bn) | — | ~4.7% |
At a 10.1% operating margin, a ¥22bn annual headwind equals roughly 0.46% of revenue — or about 4.6 percentage points of operating profit. For Canon’s US camera business, which operates at significantly higher margins than the company average, the effective margin impact on those products is more acute.
The EU comparison matters here. European competitors — German precision optics, Dutch technology conglomerates, UK medical device companies — export to the US at 10%. For products where Canon and European competitors overlap (industrial optics, medical imaging), the 2.5% tariff cost is a structural disadvantage in US price negotiations that did not exist before this month.
Why Net Profit (+13.4%) Outpaced Operating Profit (+7.6%)
The H1 income statement contains a notable anomaly: tax-before profit grew +13.4%, meaningfully faster than operating profit at +7.6%. The difference is explained by the “other non-operating items” line, which swung from ¥3.5bn to ¥19.5bn — an improvement of ¥16.0bn.
This improvement is almost certainly foreign exchange-driven. Canon’s balance sheet holds substantial overseas assets. As the yen weakened against the dollar and euro in H1 2026, the yen-denominated value of those assets and overseas receivables increased, generating non-operating gains. This is not a repeating item — it moves with FX, not with operational performance.
Investors should treat the 13.4% growth in tax-before profit as partially overstated relative to Canon’s operational trajectory. The operating profit growth of +7.6% more accurately represents what the business is delivering.
Full-Year Guidance: Why Management Is Braking
Canon guided full-year operating profit at ¥465bn (+2.1% YoY) — a number that appears conservative against H1’s +7.6% pace. At 49.6% of the full-year target achieved in H1, the company is precisely on track arithmetically. But management’s +2.1% full-year guidance implies H2 operating profit essentially flat to prior-year H2.
Three factors explain this caution:
Industrial uncertainty. With the Industrial segment down 33% in H1, management has limited visibility on H2 recovery. Semiconductor equipment order cycles are long, and customer purchasing decisions depend on wafer fab utilization rates that remain difficult to forecast in the current macro environment.
Tariff absorption costs. The Section 301 tariff took effect on July 24 — meaning its full impact falls entirely in H2 FY2026. H1 earnings were unaffected. Management’s H2 operating profit guidance already factors in approximately ¥10-11bn of additional tariff cost relative to the prior year.
Currency assumptions. The non-operating FX gains that boosted H1 earnings will not repeat at the same magnitude unless yen depreciation accelerates further. Management is appropriately not banking on a repeat.
What This Quarter Signals for the Full Year
The Imaging upgrade cycle has momentum. Professional and enthusiast camera demand is driven by product cycle transitions and content production — neither of which is showing signs of imminent reversal. Canon’s surveillance camera business benefits from infrastructure spending that is multi-year in nature.
The Printing segment’s gross margin improvement is a structural positive, not a one-quarter aberration. Canon has been steadily reducing its manufacturing cost base in this segment for years; the results are showing.
The risk concentrations are clear: Industrial’s recovery timeline is opaque, and the Americas tariff headwind is now a permanent feature of Canon’s cost structure. For investors modeling Canon’s US profitability, the pre-July 24 margin assumptions need revision.
Source: Canon H1 FY2026 Earnings Release (TDnet) | Section 301 Collateral Damage: Who Pays | 日本語版
Disclaimer | This article is for informational purposes only and does not constitute investment advice. Tariff impact estimates are approximations based on publicly available geographic segment data.