Sansan (TSE:4443) posted its strongest full-year results since listing, with FY2026 (ending May 2026) GAAP operating profit surging 192% on 24% revenue growth. The numbers tell a clean operating-leverage story: three years of heavy investment in Bill One, its invoice-processing SaaS, are translating into high-margin, recurring revenue with minimal incremental cost. For investors trying to distinguish between Japanese SaaS companies that are genuinely scaling vs. those still burning cash for growth, Sansan’s FY2026 report deserves a close read.
Financial Highlights
| Metric | FY2026 | FY2025 | YoY |
|---|---|---|---|
| Revenue | ¥53.8bn | ¥43.2bn | +24.4% |
| Adj. Operating Profit | ¥8.4bn | ¥3.6bn | +137.0% |
| GAAP Operating Profit | ¥8.2bn | ¥2.8bn | +192.3% |
| Net Profit | ¥6.8bn | ¥0.4bn | — |
| Adj. OP Margin | 15.7% | 8.2% | +7.5pp |
| Equity Ratio | 36.4% | 31.2% | +5.2pp |
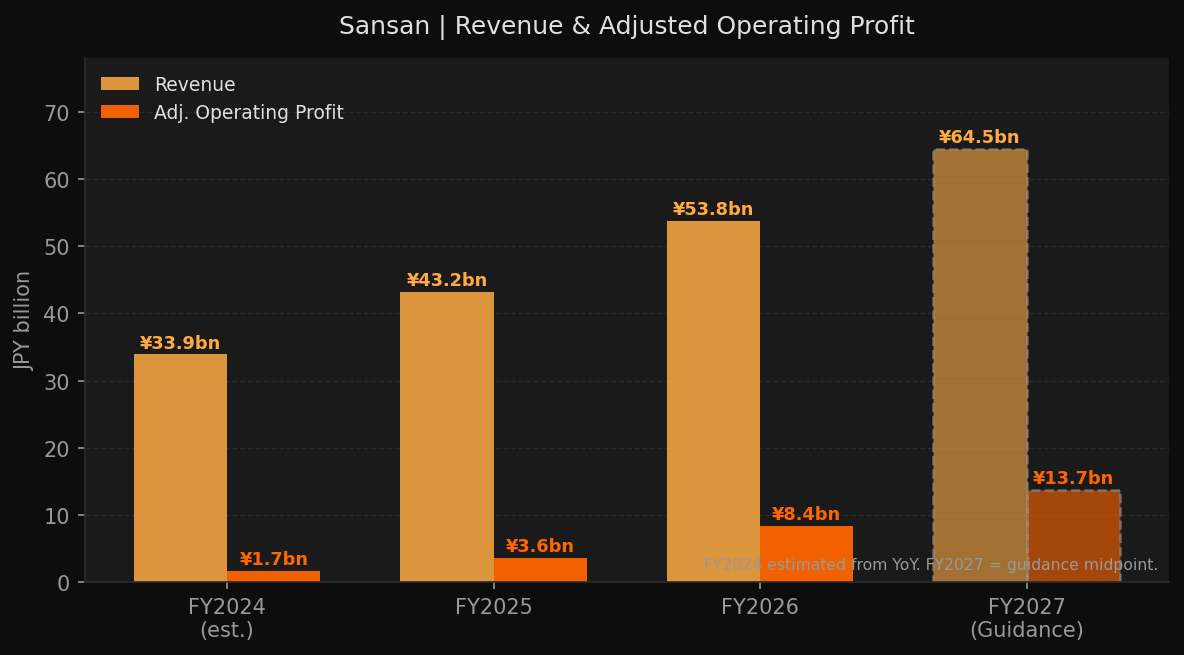 Figure 1: Revenue and Adjusted Operating Profit — FY2024 (est.) through FY2027 guidance midpoint (JPY bn)
The headline is the margin expansion. Adjusted operating margin moved from 8.2% to 15.7% in a single year — a 7.5 percentage point jump that reflects both the maturity of the core Sansan product and the rapid scaling of Bill One past its initial acquisition cost curve.
The Land-and-Expand Stack
Sansan’s business is built on a simple but durable insight: enterprise relationships start with a business card, but they don’t end there. The company has systematically expanded the “surface area” of each customer relationship:
Sansan (core) — digitises corporate business card data into a searchable relationship intelligence platform. This is the original product: deeply embedded, near-zero churn, effectively a permanent fixture in enterprise back-offices.
Bill One — receives, digitises, and manages invoices and expense data. Launched to capture the structural shift created by Japan’s mandatory invoice (適格請求書) system, which took effect in October 2023. Companies that adopted Bill One for compliance quickly found the workflow benefits extended well beyond the regulatory requirement.
Contract One — contract lifecycle management. The newest pillar, still in early adoption but positioned to capture the document-management layer between Bill One and the broader ERP ecosystem.
The genius of this stack is that each product deepens the same customer relationship at minimal incremental acquisition cost. A Sansan contract customer already trusts the vendor with sensitive business data; selling Bill One is more of an upsell conversation than a new sales cycle.
Bill One: From Compliance Tool to Growth Engine
The FY2026 KPIs confirm Bill One has moved past the “compliance tailwind” phase into genuine product-led growth:
- MRR: ¥913M/month (+34.9% YoY), implying annualised run-rate of ~¥11bn
- Contracts: 3,932 (+31.9% YoY)
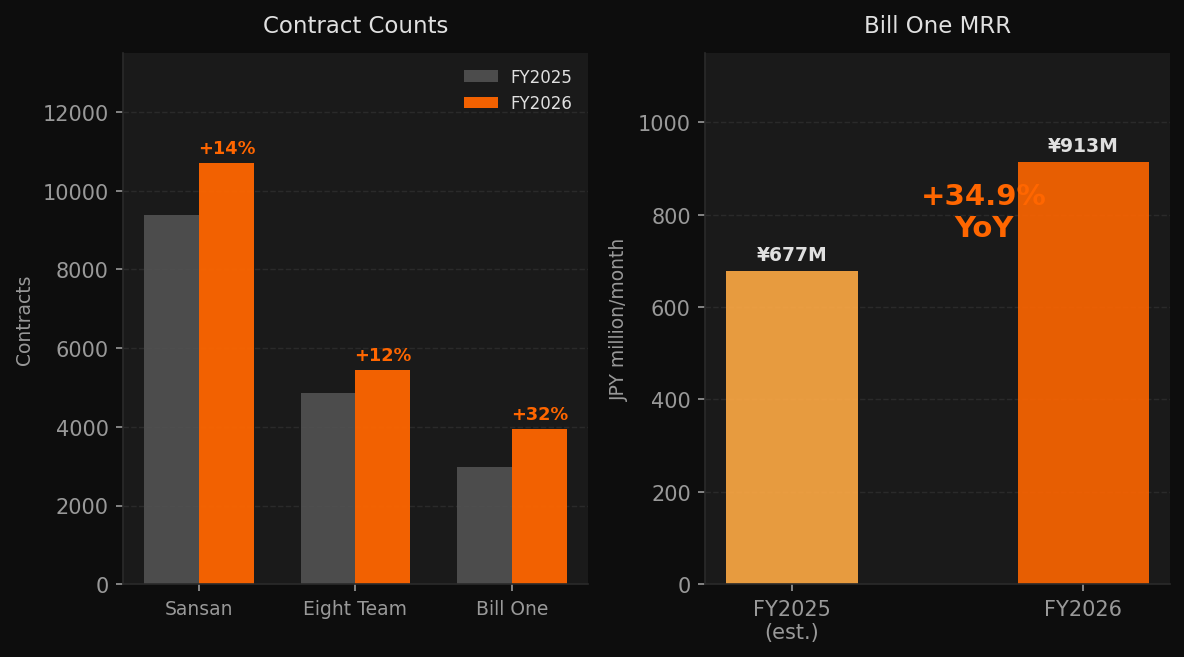 Figure 2: Contract counts by product (FY2025 vs FY2026) and Bill One MRR growth
For context: Bill One’s ARR of ~¥11bn is already running at roughly 20% of total group revenue, yet it was functionally zero four years ago. The unit economics are strong — contracts that began as インボイス制度 compliance tools are expanding in scope as customers discover the full workflow benefits.
The Sansan core product also grew solidly:
- Contracts: 10,701 (+14% YoY)
- Monthly churn: 0.55% (implies ~93% annualised retention)
- Average unit price: -1% YoY — modest compression, likely from competitive pressure at the SME tier
Eight Team (HR network product) added 12.1% more contracts to 5,451, though it remains a smaller contributor to revenue.
FY2027 Guidance: The Margin Story Accelerates
Management set FY2027 guidance in a range format:
| Metric | Low | High | vs FY2026 |
|---|---|---|---|
| Revenue | ¥63.7bn | ¥65.3bn | +18.5 to +21.5% |
| Adj. Operating Profit | ¥12.7bn | ¥14.7bn | +51.2 to +74.4% |
| Net Profit | ¥8.4bn | ¥10.2bn | +24 to +51% |
The implied midpoint Adj. OP margin for FY2027 is approximately 20-22% — a further 5-6 percentage point step-up from FY2026’s 15.7%. At the high end of guidance, Sansan would be a ¥65bn revenue business with operating margins approaching those of established enterprise SaaS companies.
Also notable: Sansan initiated its first-ever dividend (¥2.50/share for FY2026), with guidance of ¥7.50/share for FY2027. For a company that prioritised reinvestment during its growth phase, this signals management confidence in the sustainability of free cash flow generation.
What Could Go Wrong
Three risks worth monitoring:
Unit price erosion in the Sansan core. The -1% YoY decline in average revenue per Sansan contract is small, but it points to pricing pressure at the market’s edges — likely from competitors targeting price-sensitive SMEs. If this accelerates, it offsets the churn advantage.
Bill One growth deceleration. The インボイス制度 tailwind pulled forward a wave of adoptions in FY2024-2025. FY2026 still showed 35% MRR growth, but the question for FY2027 is whether product-led expansion (deeper usage within existing customers) can sustain that rate once the compliance cohort matures.
Execution risk on guidance width. The ¥2.0bn spread between the low and high end of OP guidance is wide relative to the base — implying management uncertainty about the timing of certain investments and customer expansions. Range-based guidance is common for high-growth Japanese SaaS, but it warrants scrutiny if the company trends toward the lower end early in the year.
Takeaway
Sansan’s FY2026 report validates the Land-and-Expand thesis at meaningful scale. Revenue +24%, operating profit +192% — the numbers are not coincidental; they reflect the compounding advantage of a sticky core product (Sansan) funding the customer acquisition of a faster-growing adjacent product (Bill One), which is itself now generating enough revenue to self-fund further expansion.
The FY2027 guidance — particularly the OP expansion to ¥12.7-14.7bn — suggests management believes the operating leverage is structural, not one-time. At current rates, Sansan is on track to be a ¥65bn revenue, 20%+ margin business within 18 months.
Source: Original filing (TDnet) | 日本語版
Disclaimer | This article is for informational purposes only and does not constitute investment advice.